 Hello, we are Kirstie and Autumn, User Researchers based in our Newcastle Digital Delivery Centre. At a recent cross-government User Research Community Conference we presented an expert session on first click testing to upskill our team in research methodologies. We’d like to share a bit about it here for anyone who’s interested in user research.
When we ran the session, our aim was to make it informative, fun, and practical. We split it into three parts:
- an introduction to first click testing and how to set one up
- taking part in an interactive test
- how to apply this method to tax services.
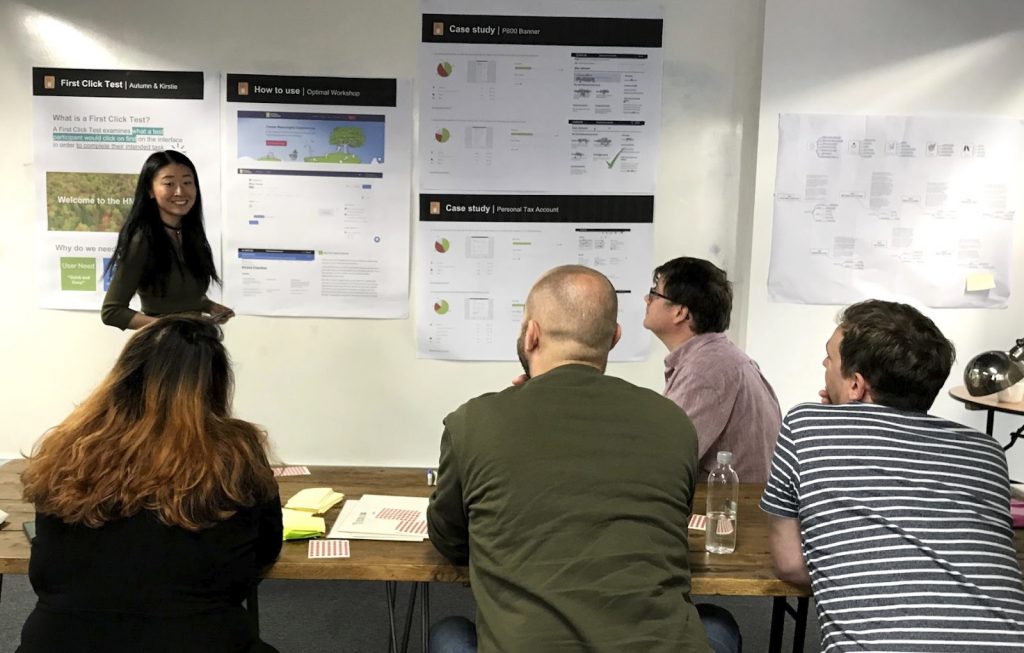
What is a first click test?
First click testing looks at what test participants click on first, in order to complete a specific task. A user’s first click is important, as most need to complete tasks quickly and easily. Standard 12 of the GDS service standard is ‘make sure users succeed first time’, and evidence shows that users who click down the correct path on the first click complete their task successfully 87% of the time. That’s a big number and, correspondingly, a user who clicks down the wrong path will only complete their task successfully 46% of the time. (source: https://measuringu.com/first-click/)
How do I run a first click test?
To conduct this type of test, you upload a screenshot of the page to be tested into a click-testing tool (we use Optimal Workshop), and create tasks for the user to complete. Participants must click on the image to indicate where they would go to carry out the task, and the result is a heatmap showing where the users clicked.
The heatmap helps you determine where users navigate on your page for your chosen tasks.
To get reliable data from your study, aim for 50 -100 completed first-click tests.
Research has shown that trends in users responses are recognisable with a minimum of 50 participants, and become clearer the more responses there are in addition to these.
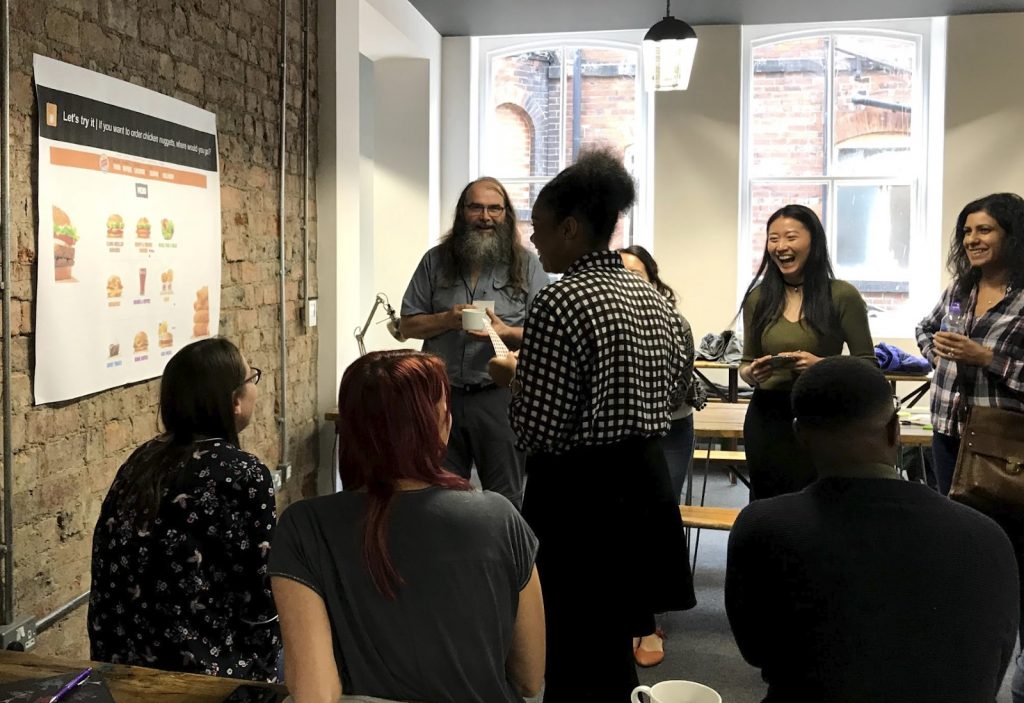
Running a first click test: engaging our audience
The best way of learning is to try it yourself. So we invited all of our participants to take a red sticker and place it where their first click would be if they were ordering chicken nuggets, on our test website. You might be wondering what chicken nuggets have to do with HMRC! This first example was just a simple one to help us bring an abstract concept to life.
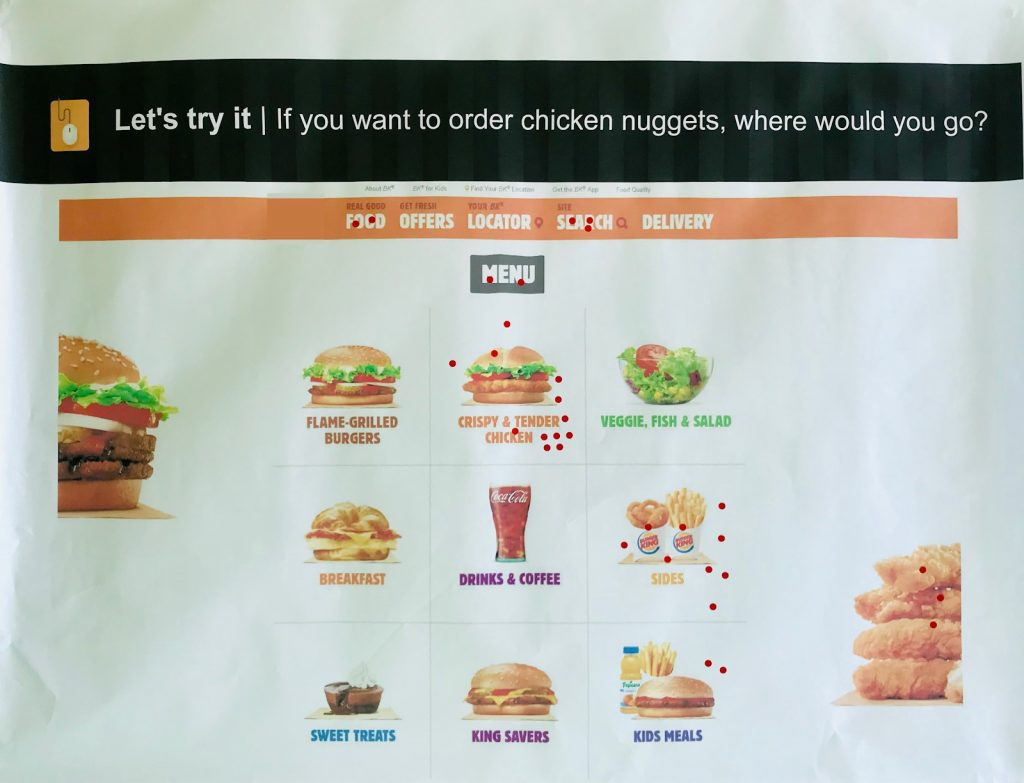
As you can see from our heatmap, the most clicks were on ‘crispy & tender chicken’ and ‘sides’. However, the right answer to order the chicken nuggets is ‘delivery’. You can only see the nutrition of the chicken nuggets under ‘sides’. The game showed all of the participants the importance of the first click and how a first click test is run from the participants point of view.
Applying this method to tax services
We then talked through two case studies where we used this research method to improve our services in the past and explained how we analysed the results.
When you analyse your study, pay attention to the success rate of your tasks, the time taken to complete the tasks and the heat map which is produced by the tool - particularly where the ‘wrong’ areas are clicked on.
Consider comparing the results of the same task with different designs, and where most users click when there are two correct answers to one task.
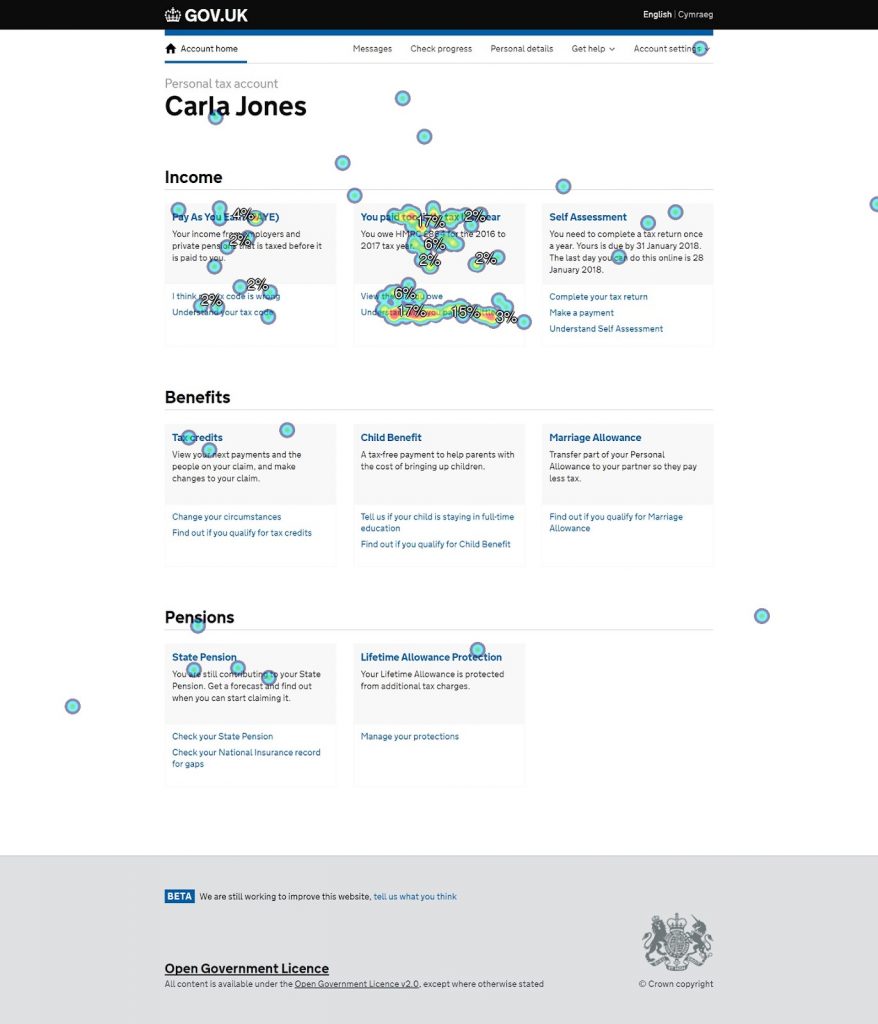
For example, when redesigning the homepage for the personal tax account, we asked users where they would go to find out why they didn’t pay enough tax last year. The heat map below shows the results. Only 38% of users clicked the correct area, which was the link in the tile that is highlighted blue.
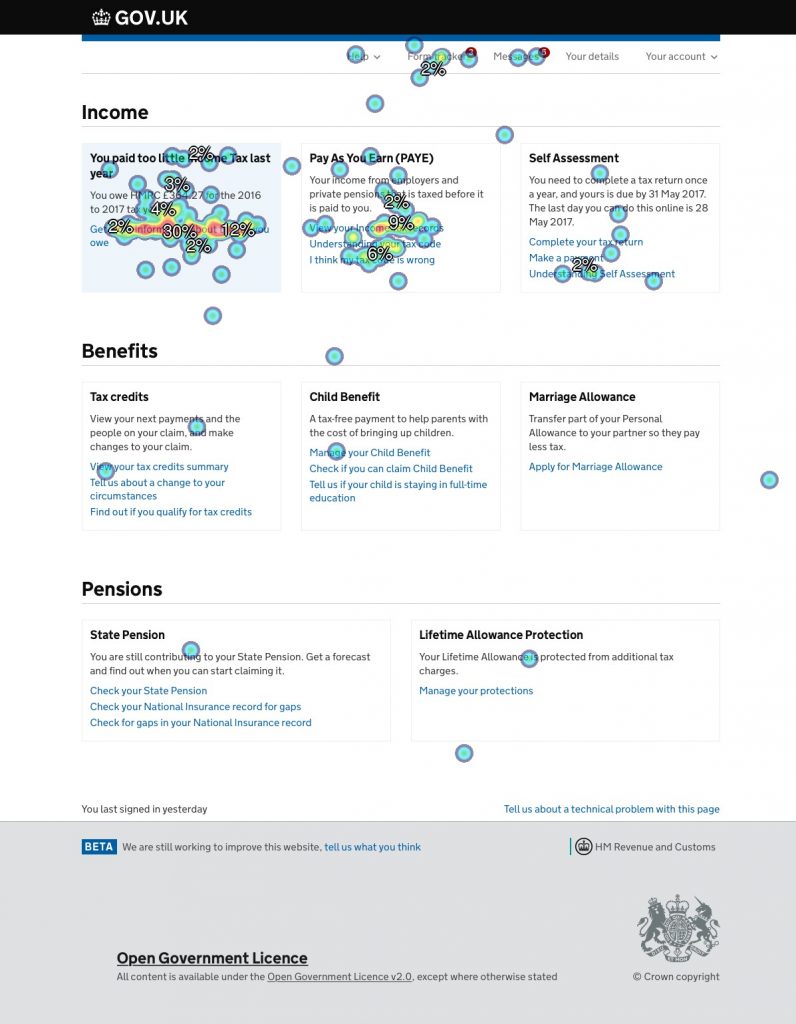
We found that users expected the tiles on the page to be clickable. From this insight we then iterated the design to make the whole area clickable, and tested the homepage again. The success rate went from 38% - 57% and the average time spent on task decreased from 5.8 seconds to 5.33 seconds.
Benefits of running a first click test
There are some clear benefits of this type of testing, including:
- tests are quick and easy to set up, and cheap to run
- they are also quick to analyse, and the visual heat maps can help you when demonstrating findings back to your team and stakeholders.
However, it’s not interactive - you use static images, which can sometimes be a drawback. Also, you can learn what a user does but, as this is a quantitative research method, you are not able to determine ‘why’ from the results of the user behaviour.
In conclusion, a first click test provides a quick and affordable way to conduct research, and produces insights to improve the navigation of your service, helping your users get it right first time.
If you want to learn more
There is a wealth of information out there to help you. We’ve listed some websites below. Or if you want to have a chat, just leave us a comment and we’ll get in touch.
First click test to find and solve 3 common usability problems
Testing tv interfaces with chalkmark
Kirstie Charlton & Autumn Wang, User Researchers
2 comments
Comment by Kirstie posted on
Yes that is possible with live services. As you say it will only monitor which link was clicked and not the actual mouse position which is why using both sets of data can certainly help when deciding where to put links and what the wording should be. We are lucky to have access to tools such as Google Analytics as well as performance analysts in our delivery centre who can help us track, report on and continually optimise pages that have been developed based on our 1st click tests. There are also other great tools such as Hotjar which can also be used to generate heat maps
Comment by Ian posted on
A well written and interesting article Kirstie and Autumn. Is there a way to used Google Analytics data to generate heat maps? Per website page it would be great to show which link a user clicked and based on whether they landed on that page (first click). It could only show which link was clicked, rather than the actual mouse position but if it was possible it could be run for all visitors, and not just those who participated in research.